Capture Packets
When diagnosing a problem, Samba developers are likely to request a packet capture (or trace).
Which tool to use ?
The best way to do this depends on the tools available on your system. It is often easiest to run the capture tool from the command-line, unless debugging a problem that requires complex capture filters to be set (to reduce the network trace).
For more complex tasks the GUI based network tools, such as wireshark, may be easier for beginners to use.
Where the tracing should be done ?
If your problem concerns file exchange then tracing can be done on the client or on the server. On the other hand if it concerns things related to authentication or Active Directory protocols it's often better to do the tracing from the server as most of the time we will need packets exchanged during the boot of the computer or during user's logon.
If tracing on the server puts too much load on the server system to reproduce the problem or results in a network trace that is too large, tracing from the client can be attempted instead.
Tracing
From the command line of the operating system type: (note: in the table below, replace FILENAME with a more descriptive file name):
| Tool | Commandline |
|---|---|
| wireshark | tshark -p -w FILENAME |
| ethereal | tethereal -p -w FILENAME |
| tcpdump | tcpdump -p -s 0 -n -w FILENAME |
| snoop | snoop -q -o FILENAME |
If you're sure the problem is only related to SMB, you can filter the traffic based on the ports:
| Tool | Commandline |
|---|---|
| wireshark | tshark -p -w FILENAME -f "port 445 or port 139" |
| ethereal | tethereal -p -w FILENAME port 445 or port 139 |
| tcpdump | tcpdump -p -s 0 -w FILENAME port 445 or port 139 |
| snoop | snoop -q -o FILENAME port 445 or port 139 |
If you know the ip address of the client you can use the following to reduce the volume of the trace:
| Tool | Commandline |
|---|---|
| wireshark | tshark -p -w FILENAME -f "host IP_ADDRESS_OF_THE_CLIENT" |
| ethereal | tethereal -p -w FILENAME host IP_ADDRESS_OF_THE_CLIENT |
| tcpdump | tcpdump -p -s 0 -w FILENAME host IP_ADDRESS_OF_THE_CLIENT |
| snoop | snoop -q -o FILENAME host IP_ADDRESS_OF_THE_CLIENT |
Where IP_ADDRESS_OF_THE_CLIENT is the IP of the client, something like 192.168.1.2 or 2001:db8:0:85a3::ac1f:8001.
Using a ringbuffer with tcpdump
tcpdump can write traces to a ringbuffer using a configurable number of files (-W option) where each file will be limitted to a specified size (-C option):
tcpdump -W 10 -C 50 -w smb.pcap -s 0 port 445

-W = max number of files
-C = size in MB
How to use graphical user interface
In many cases the process is as simple as the following, from your client (e.g. Windows workstation):
- Download and install Wireshark.
- Launch Wireshark from the Windows "All Programs" menu list
- Start the capture
- Do the operation that causes trouble
- Stop the capture
- Save the trace and send the trace to the developer working on your problem (or attach it or a URL to the saved trace file location to the bugzilla bug).
Additional remarks
For some type of problems it is also important that we see the beginning of the SMB connection. You can cause the Windows client to reconnect if you first kill the Samba server's smbd process which is servicing your client before starting the trace. You do not have to restart all of Samba.
You can find out the smbd responsible for your client by running the tool smbstatus on the server.
If the problem didn't occur at login or is reproducible while the user is logged, the tracing should be started just before the operation that fails. Nevertheless most of the time part of the traffic will be encrypted, and in order for the trace to be exploitable you will need the initial key exchange.
The best way to do it is to force Windows to discard all your Kerberos tickets, so that when you'll repeat the operation in error Windows will also re-ask for Kerberos tickets and so the trace will contain all the needed information for the developer.
To force Windows to discard your Kerberos tickets:
- On Windows XP or Windows Server 2003
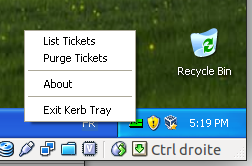
- You will need the program called kerbtray.exe in C:\Program Files\Windows Resource Kits\Tools you can get it from the resource kit. Once started you'll see a green ticket in the systay, to purge right click on the icon and select purge ticket as show on the capture below.
- On Windows Vista and newer or Windows Server 2008 and newer
- The tool ktutil.exe is shipped with this version of Windows, to purge ticket just do the following:
ktutil purge
